Performance Test - Large Object#3
Benchmark LeoFS v1.3.0
Purpose
We check Read/Write Performance of Large File with LeoFS
Issues
Summary
- Put 500 x 1GB Files with S3Cmd
- Parallel spawn 16 instances
- Base File is served through memdisk
/dev/shm/
- During Loading Phase, the throughput is bounded by Disk I/O rate
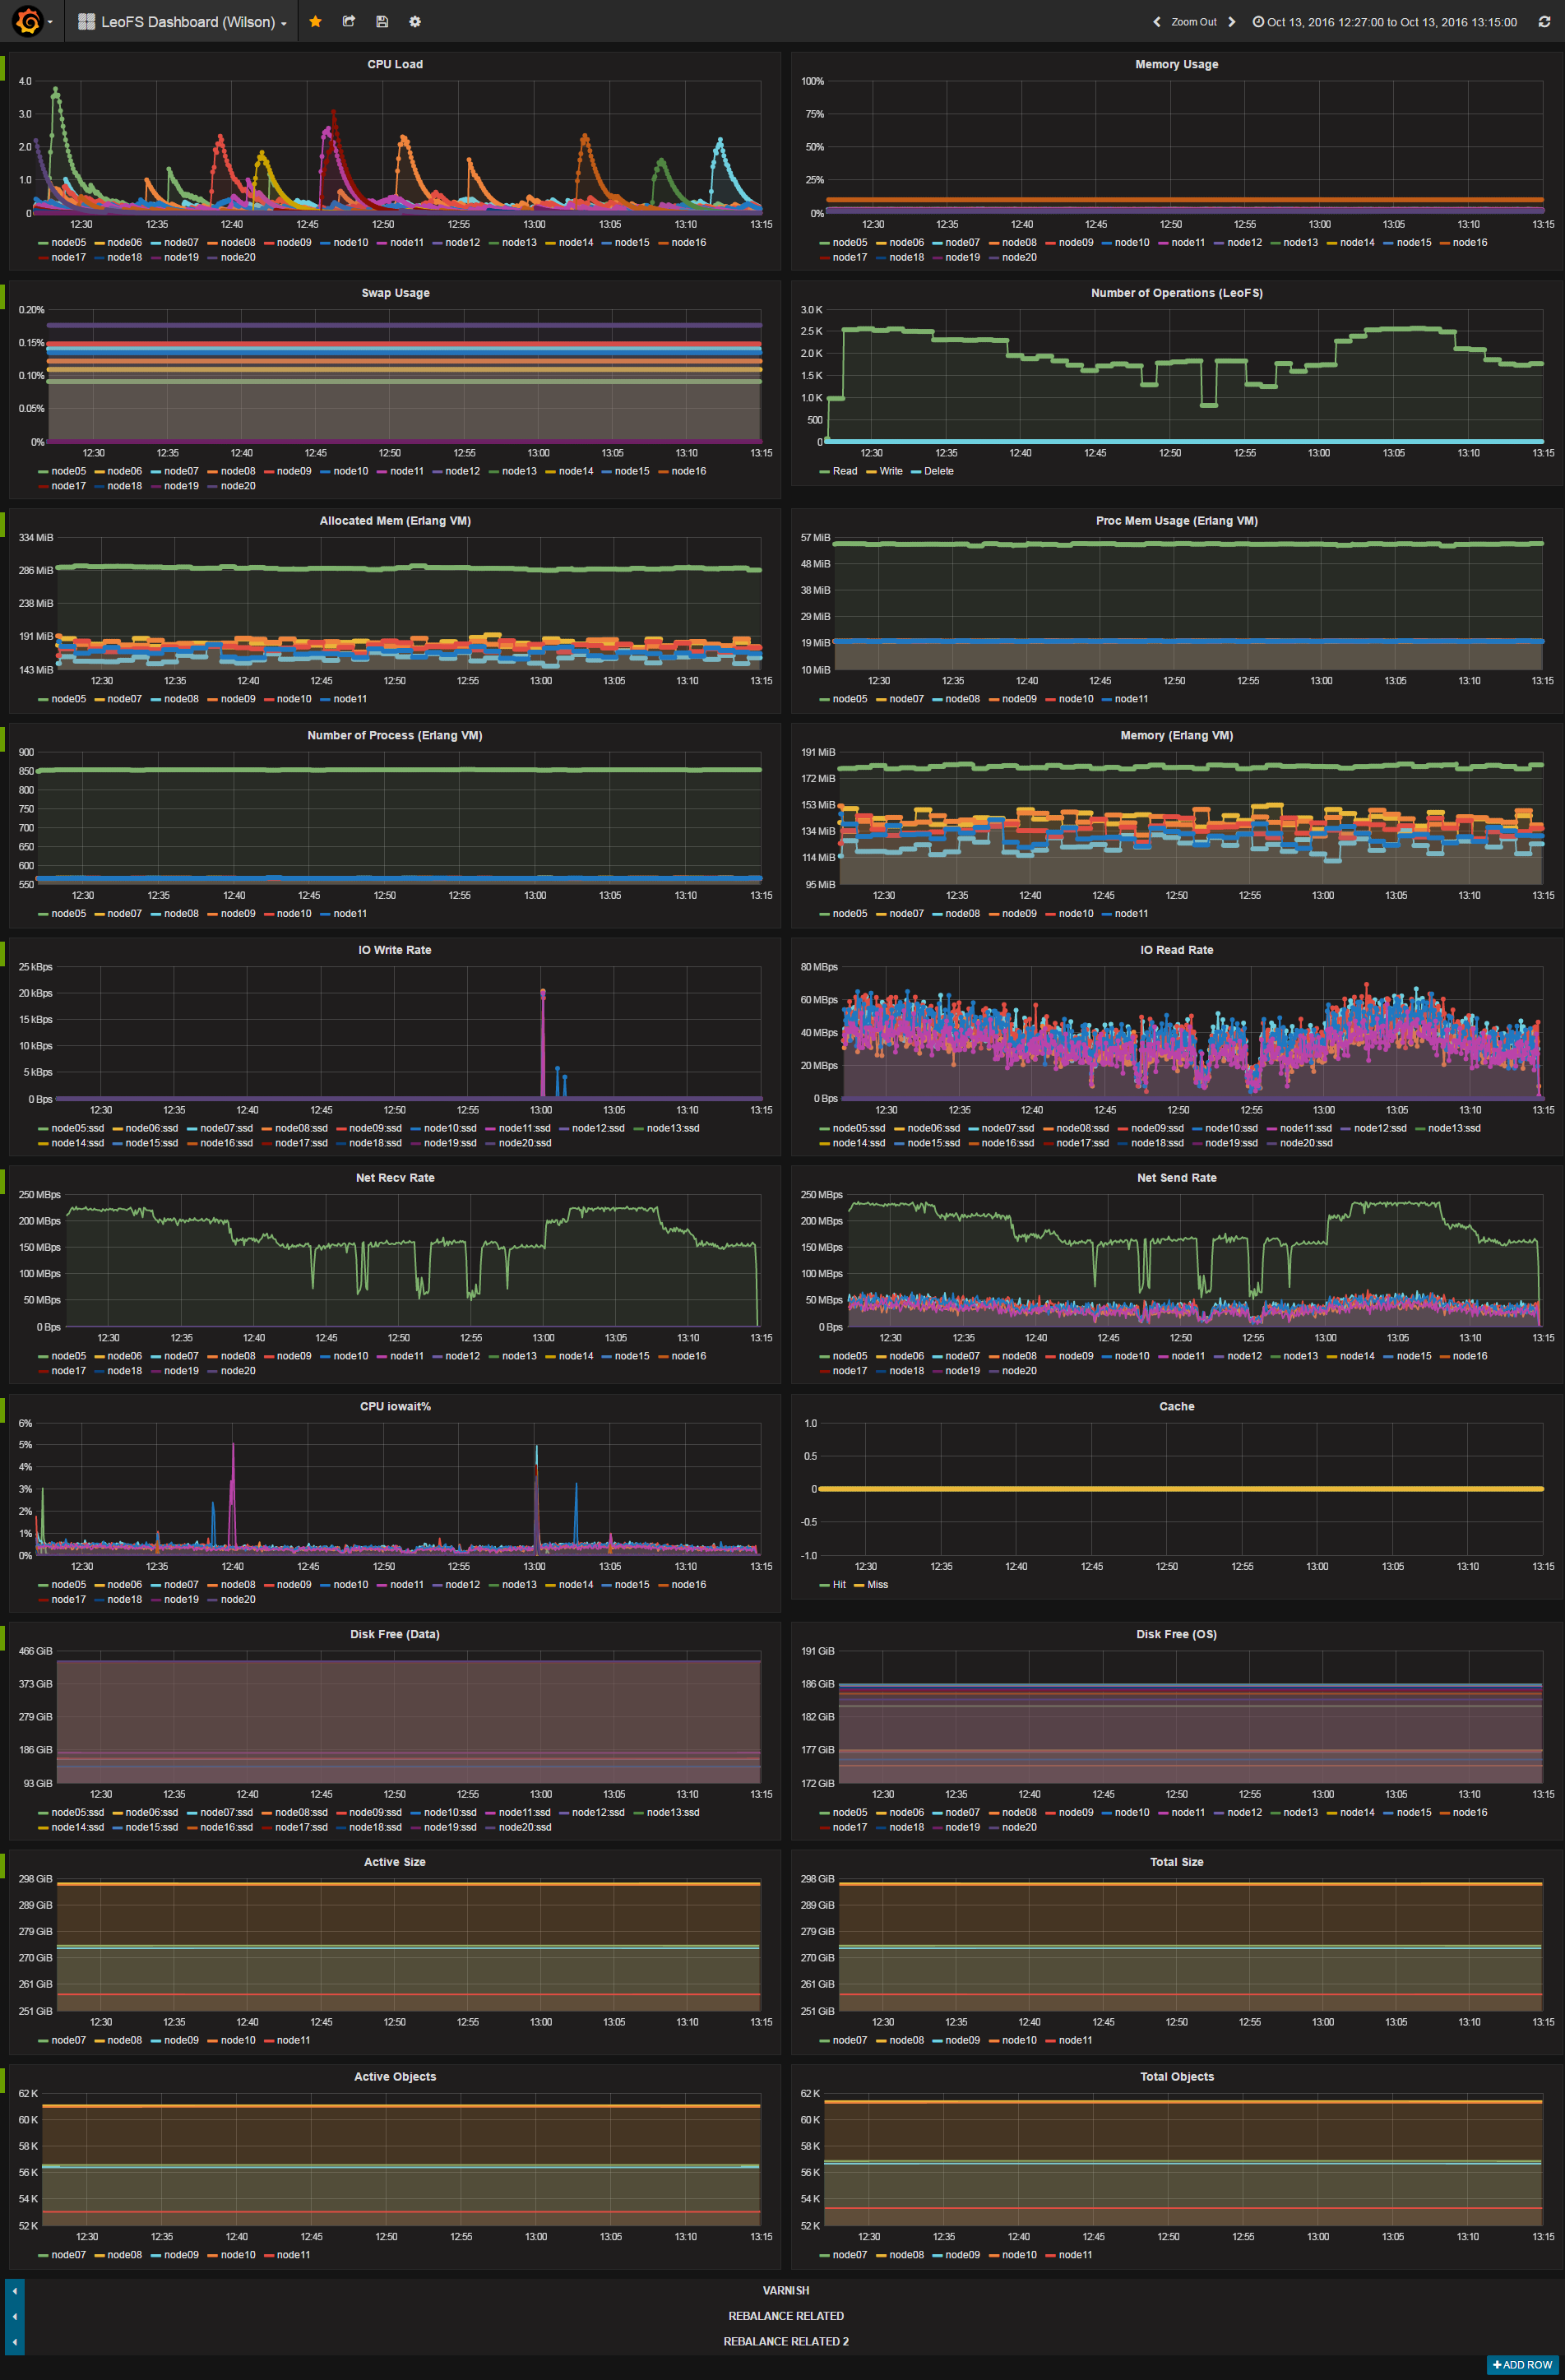
- During Reading Phase, decrease in throughput is observed
- Start with 250MB/s, drop to 150MB/s after 10 minutes
- Occasional drop to 50MB/s
- To rule out effect from
basho_bench, a simple bash script is used to verify- Same situation
-
As page cache is dropped before every test, try to execute once in the middle
$ sync && echo 3 | sudo tee /proc/sys/vm/drop_caches- At 13:00, drop page cache of all nodes (gateway, storage) - Throughput shows improvement immediately, back to 250MB/s from 150MB/s - Afterwards showing similar trend as the beginning - (As page cache is filled?)
Next Action
- Research on why throughput is better when page cache is empty (dropped)
- Detailed breakdown of latency in each processes
Environment
- OS: Ubuntu Server 14.04.3
- Erlang/OTP: 17.5
- LeoFS: 1.3.0
- CPU: Intel Xeon E5-2630 v3 @ 2.40GHz
- HDD (node[36~50]) : 4x ST2000LM003 (2TB 5400rpm 32MB) RAID-0 are mounted at
/data/, Ext4 - SSD (node[36~50]) : 1x Crucial CT500BX100SSD1 mounted at
/ssd/, Ext4
1 2 3 4 5 6 7 8 9 10 11 12 13 14 15 16 17 18 19 20 21 22 23 24 25 26 27 28 29 30 31 32 33 34 35 36 37 38 | [System Confiuration] -----------------------------------+---------- Item | Value -----------------------------------+---------- Basic/Consistency level -----------------------------------+---------- system version | 1.3.0 cluster Id | leofs_1 DC Id | dc_1 Total replicas | 3 number of successes of R | 1 number of successes of W | 2 number of successes of D | 2 number of rack-awareness replicas | 0 ring size | 2^128 -----------------------------------+---------- Multi DC replication settings -----------------------------------+---------- max number of joinable DCs | 2 number of replicas a DC | 1 -----------------------------------+---------- Manager RING hash -----------------------------------+---------- current ring-hash | 4adb34e4 previous ring-hash | 4adb34e4 -----------------------------------+---------- [State of Node(s)] -------+------------------------+--------------+----------------+----------------+---------------------------- type | node | state | current ring | prev ring | updated at -------+------------------------+--------------+----------------+----------------+---------------------------- S | S1@192.168.100.37 | running | 4adb34e4 | 4adb34e4 | 2016-10-13 10:29:31 +0900 S | S2@192.168.100.38 | running | 4adb34e4 | 4adb34e4 | 2016-10-13 10:29:31 +0900 S | S3@192.168.100.39 | running | 4adb34e4 | 4adb34e4 | 2016-10-13 10:29:31 +0900 S | S4@192.168.100.40 | running | 4adb34e4 | 4adb34e4 | 2016-10-13 10:29:31 +0900 S | S5@192.168.100.41 | running | 4adb34e4 | 4adb34e4 | 2016-10-13 10:29:31 +0900 G | G0@192.168.100.35 | running | 4adb34e4 | 4adb34e4 | 2016-10-13 10:29:32 +0900 -------+------------------------+--------------+----------------+----------------+---------------------------- |
-
Test Configuration:
- Tool: s3cmd-1.6.1
- Object Size: 1 GB
- Number of Objects: 500
- Number of Threads: 20
- Multipart Upload Part Size: 5 MiB
-
basho-bench Configuration:
- Duration: 30 minutes
- Total number of concurrent processes: 16 (load) 1 (read)
- Total number of keys: 500
- basho_bench driver: basho_bench_driver_s3cmd.erl
- Configuration file:
-
LeoFS Configuration:
- Manager_0: leo_manager_0.conf
- Gateway : leo_gateway.conf
- Disk Cache: 0
- Mem Cache: 0
- Storage : leo_storage.conf
- Container Path: /ssd
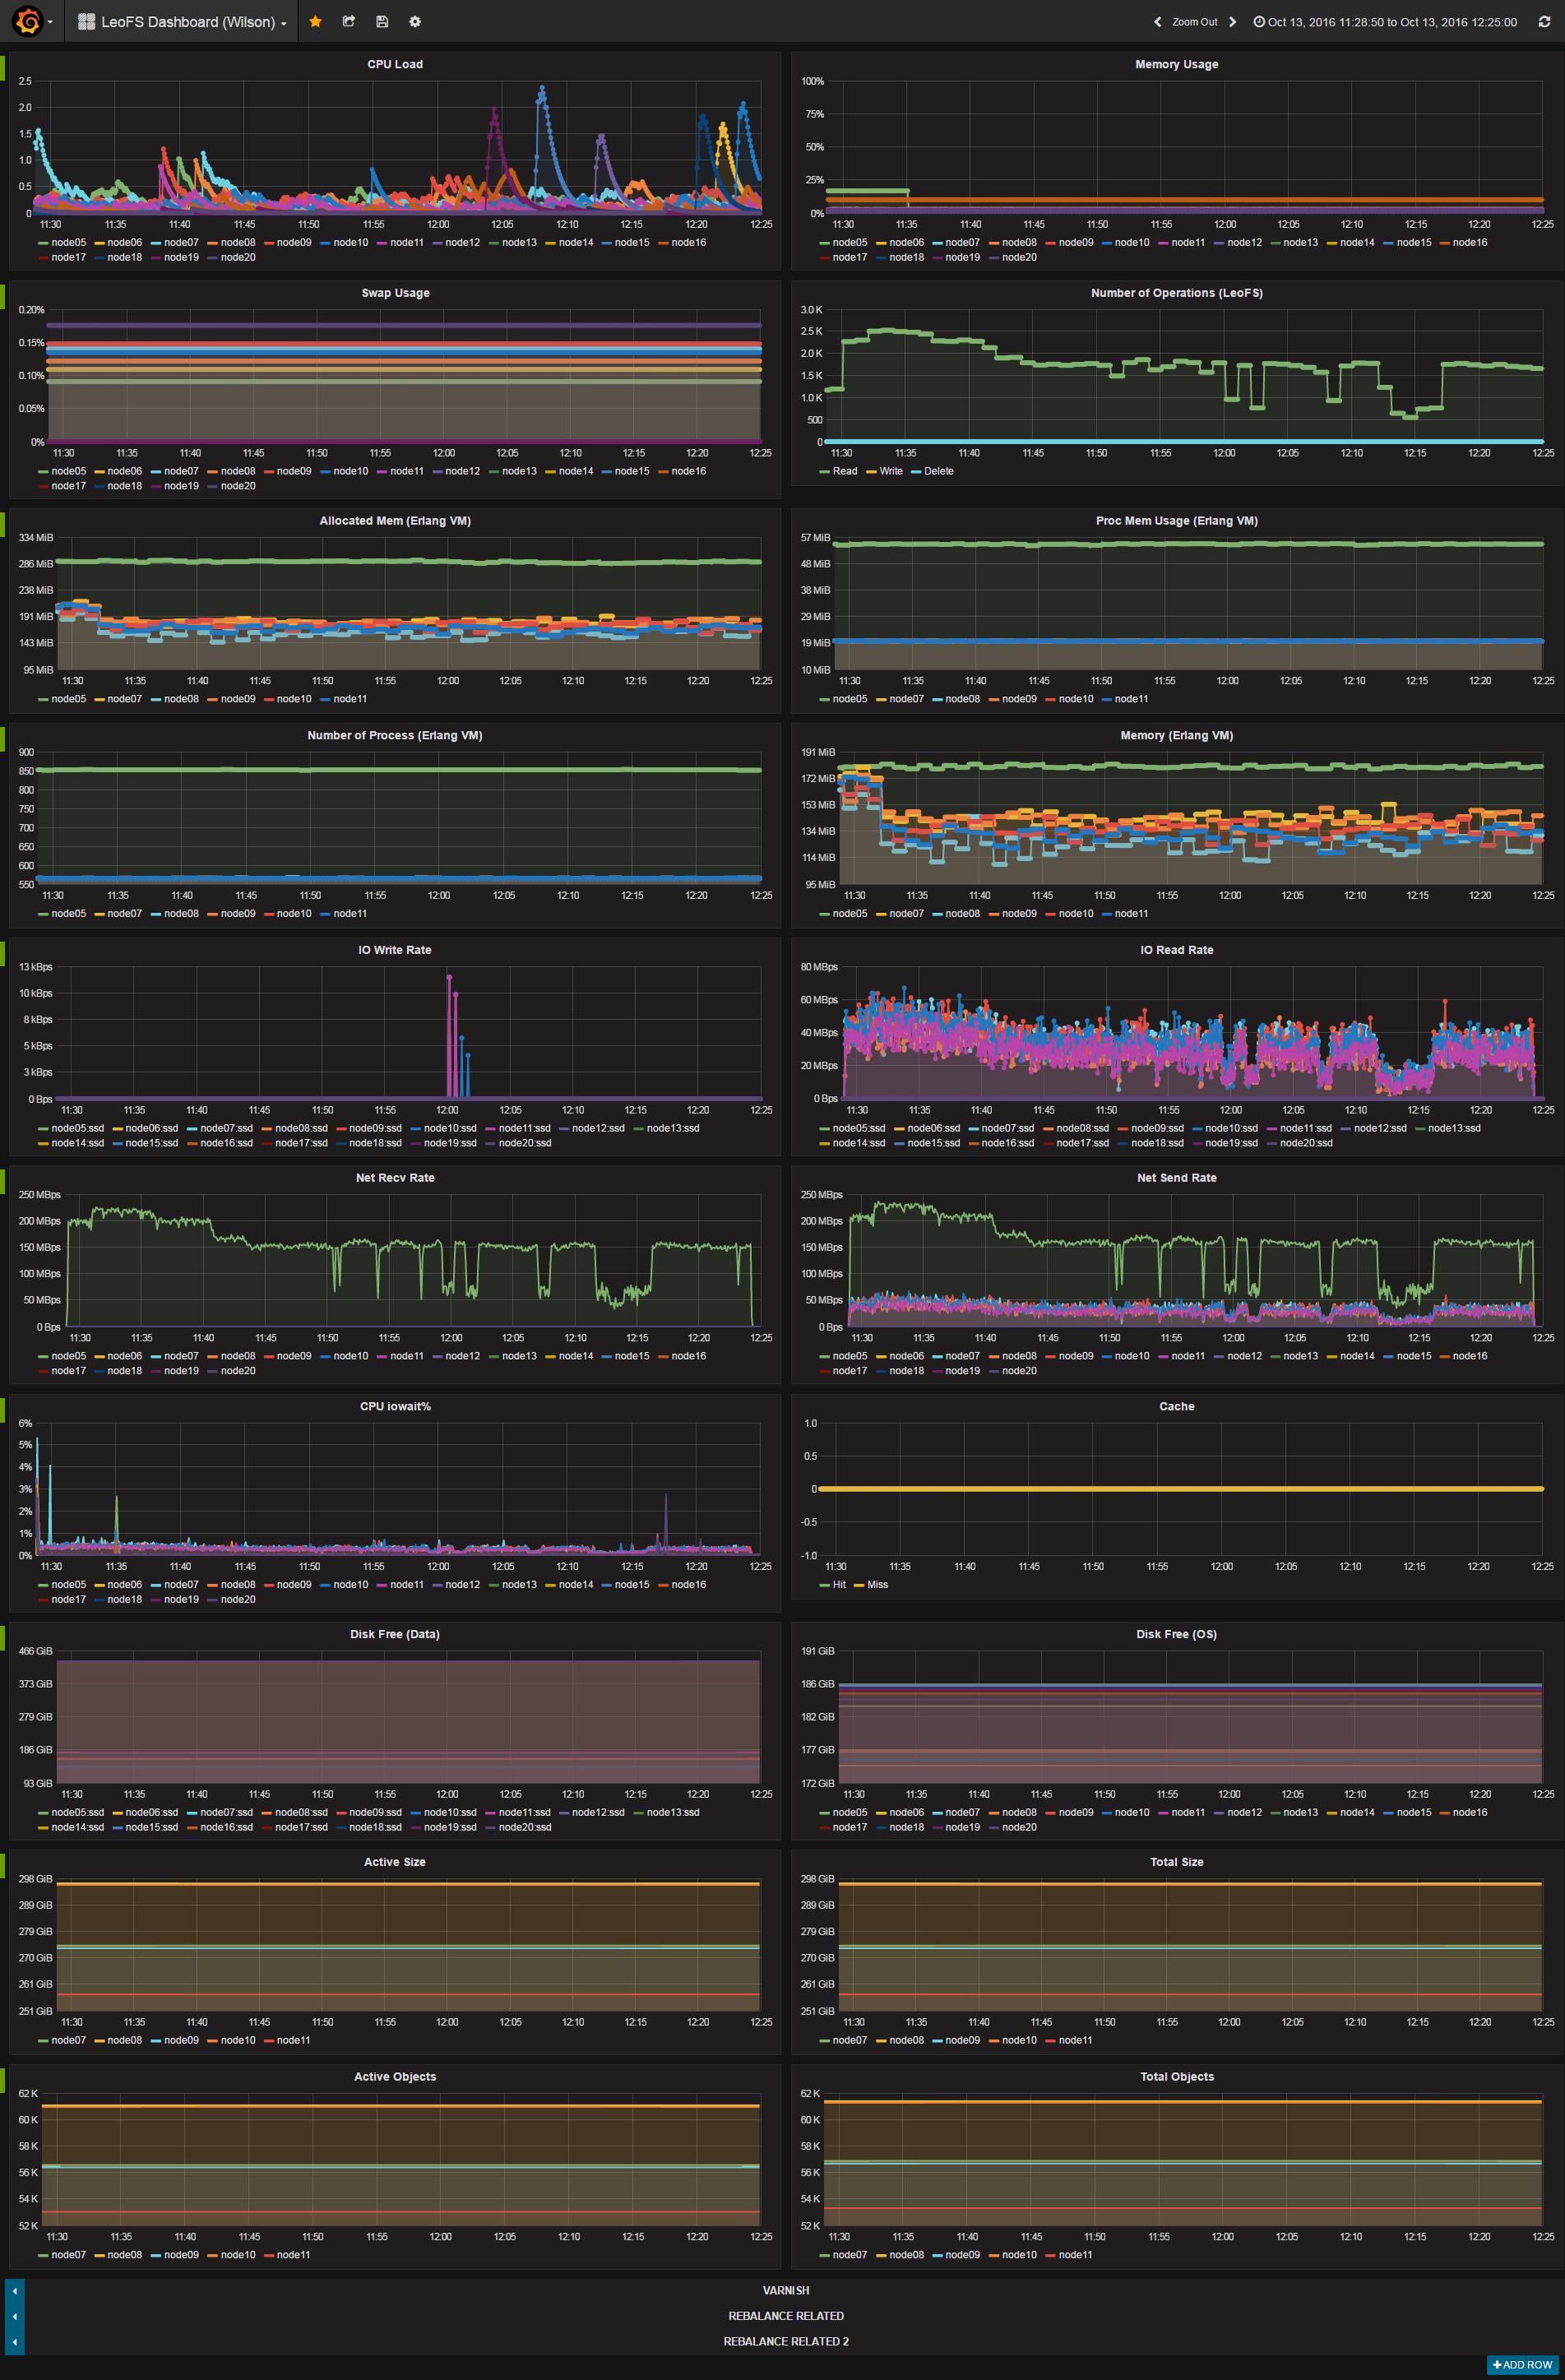
Monitoring Results:
-
Loading
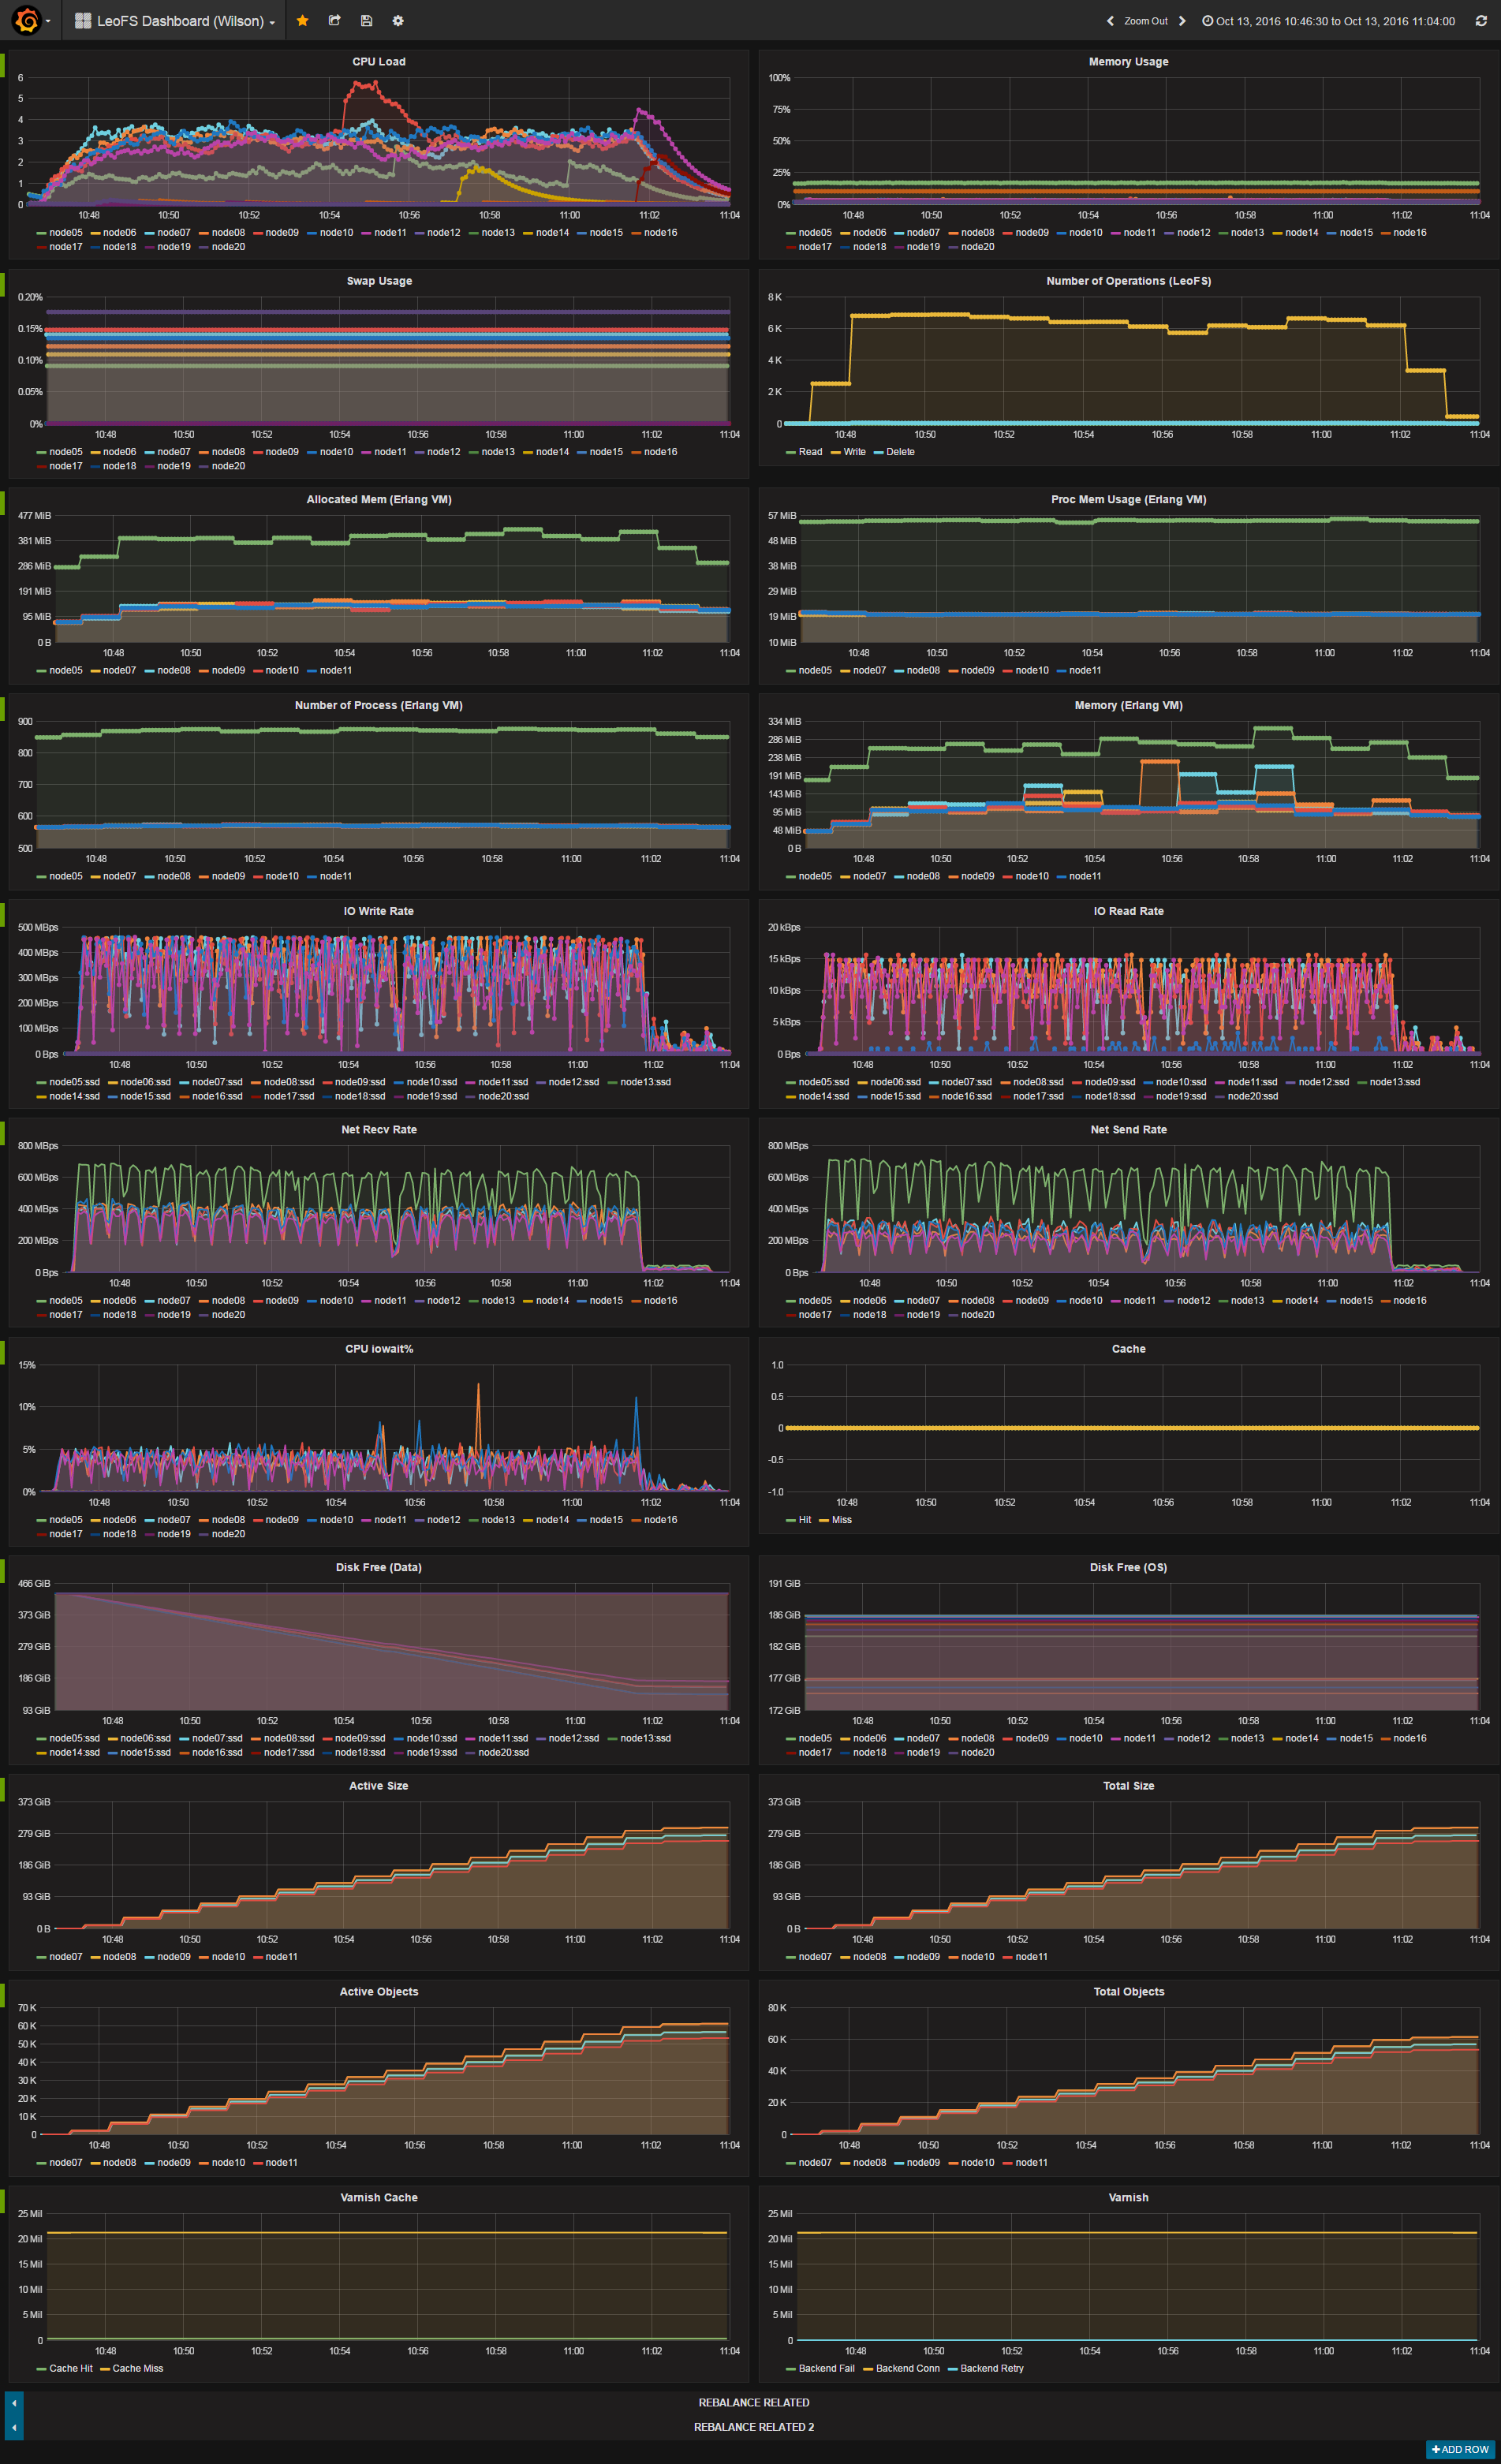
-
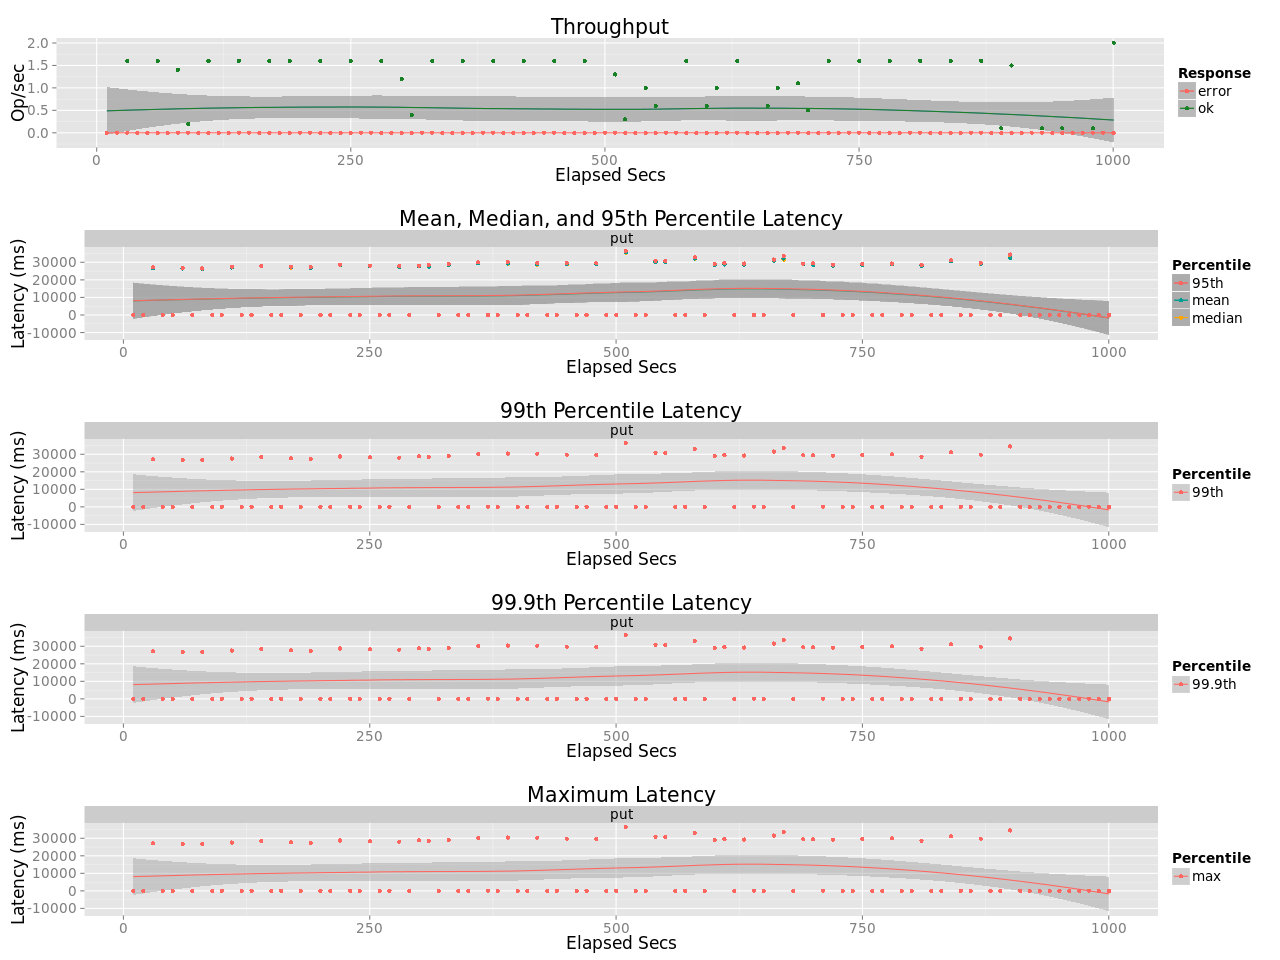
Reading
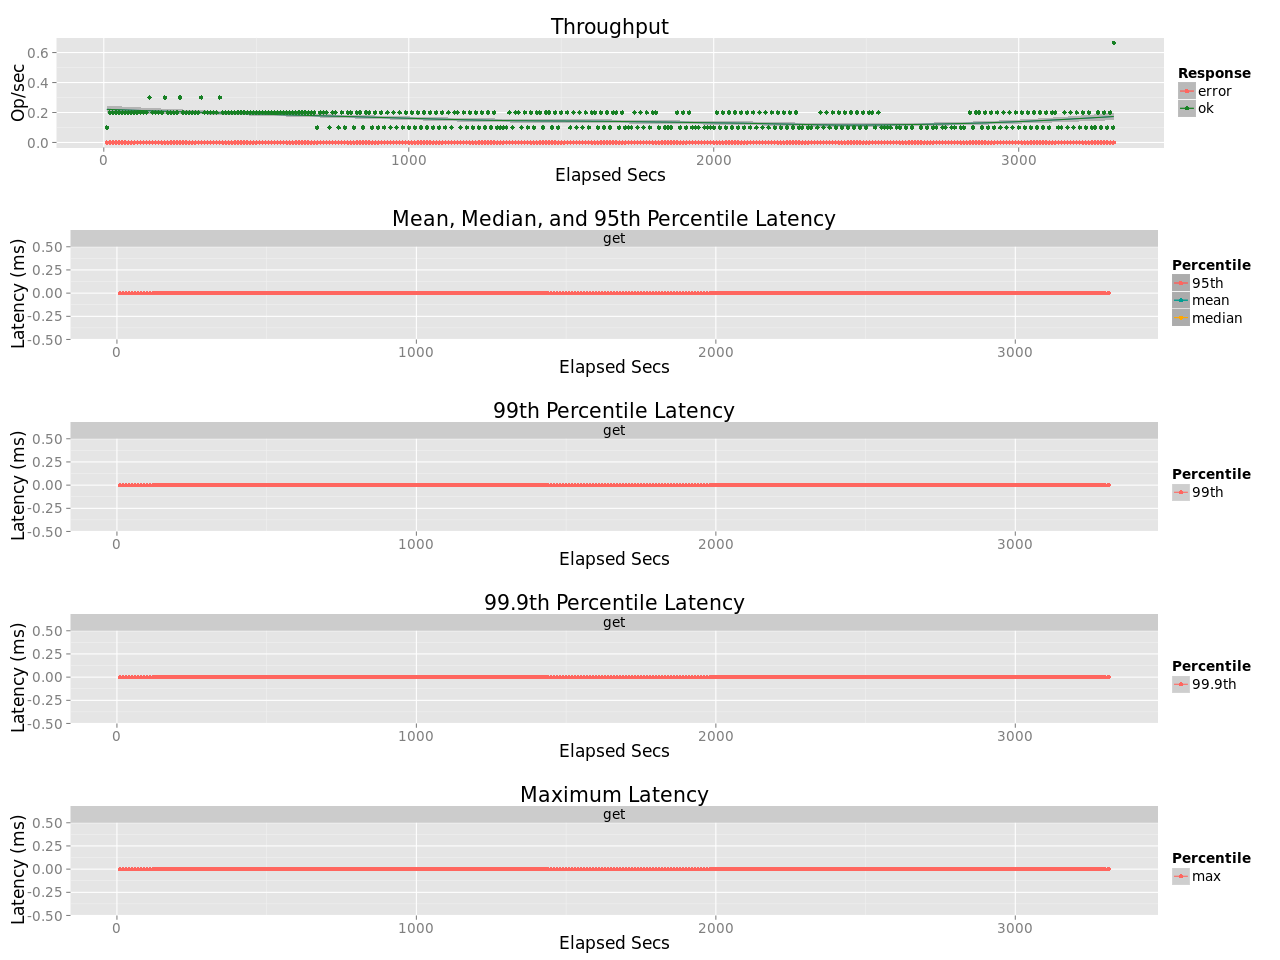
-
Reading (Drop Cache at 1300)